
 Student Satisfaction Survey 2024 Form
Notice Board
Home
WELCOME TO VASANTDADA PATIL ARTS, COMMERCE & SCIENCE COLLEGE PATODA …
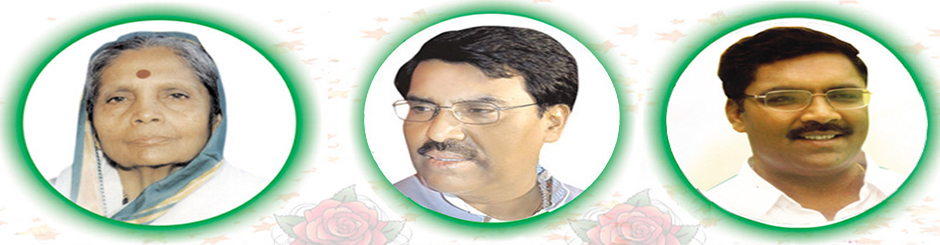
Navgan Shikshan Sanstha Rajuri (Navagan) Dist. Beed is a reputed institution in education field in Beed district. It is proved to be an institution providing quality education in rural as well as urban areas. It was established in 1963 by Late Mrs. Kesharbai Kshirsagar alias ‘Kaku’, the former Member of Parliament. Her vision and insight made the small seed grow into a huge tree encompassing thousands of students of rural and remote area of Beed district seeking primary to higher education.
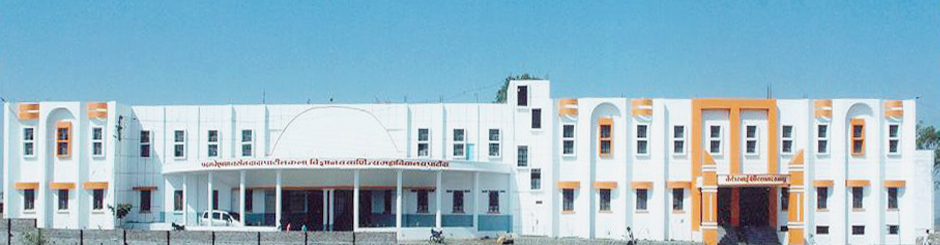
The Navgan Shikshan Sanstha started Vasantdada Patil Arts, Commerce & Science College (Previously known as Padmabhushan Vasantdada Patil college) at Patoda in 1989 to create awareness of educational, social, political and economic development amongst laboers, farmers, and deprived people of Patoda region, which is an interior and drought prone area. After completion of a successful journey of around 30 years, our institution has earned grand popularity not only in Marathwada region but throughout the state. We are proud to be known as the best institution in rural area that provides ample infrastructure facilities and quality higher education to especially deprived class of rural society.
THE MOTTO
“ EDUCATION FOR ENLIGHTENMENT ”
THE VISION
"Eradicating Ignorance from the lives of people through education
and
helping them achieve light of knowledge and wisdom
to build successful and peaceful life."